Bollinger Bands indicator: A Comprehensive Guide to Trading Strategies
Bollinger Bands indicator: A Comprehensive Guide to Trading Strategies
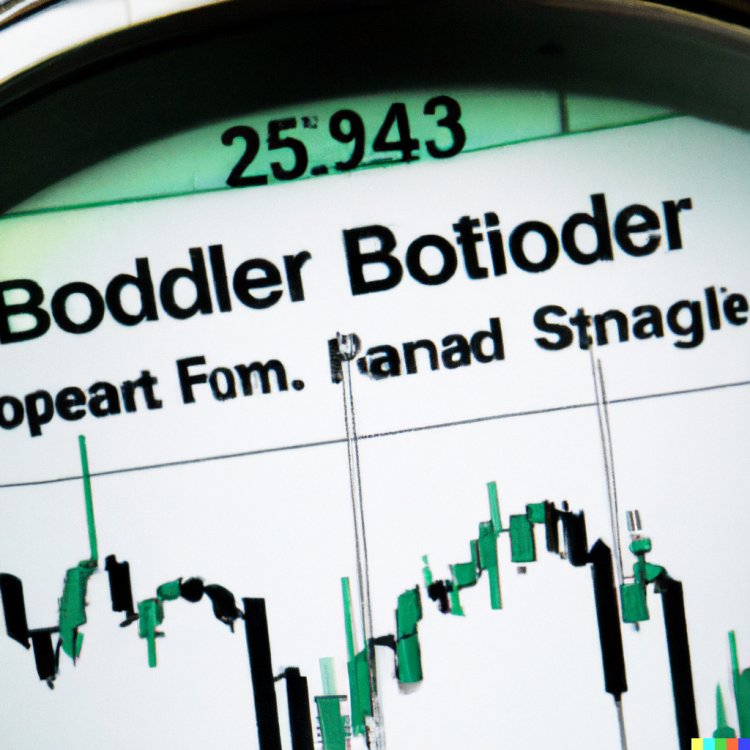
Discover the power of Bollinger Bands in this comprehensive guide. Learn how to interpret and use Bollinger Bands effectively in your trading strategy. Explore various trading techniques and approaches that leverage Bollinger Bands to identify potential buy and sell signals. This informative resource provides insights into setting up Bollinger Bands, understanding their significance, and implementing them in real-world trading scenarios. Whether you're a beginner or an experienced trader, this guide will equip you with the knowledge to optimize your trading decisions using Bollinger Bands.
// Bollinger Bands Expert Advisor
// By OpenAI Assistant
extern double LotSize = 0.01;
extern int Period = 20;
extern double Deviation = 2.0;
void OnTick()
{
double upperBand = iBands(NULL, 0, Period, Deviation, 0, PRICE_CLOSE, MODE_UPPER, 0);
double lowerBand = iBands(NULL, 0, Period, Deviation, 0, PRICE_CLOSE, MODE_LOWER, 0);
double currentPrice = Ask;
if (currentPrice > upperBand)
{
// Sell order condition
if (OrdersTotal() == 0)
{
OrderSend(Symbol(), OP_SELL, LotSize, Ask, 3, 0, 0, "Bollinger Bands EA", 0, 0, Red);
}
}
else if (currentPrice < lowerBand)
{
// Buy order condition
if (OrdersTotal() == 0)
{
OrderSend(Symbol(), OP_BUY, LotSize, Bid, 3, 0, 0, "Bollinger Bands EA", 0, 0, Green);
}
}
}
Explain:
Certainly! Let me explain the code step by step:
-
The code starts with the declaration of three input parameters that can be adjusted when attaching the EA to a chart in MetaTrader 4:
LotSize,Period, andDeviation. These parameters allow you to customize the lot size for trades and adjust the period and standard deviation for the Bollinger Bands. -
The
OnTick()function is the main function that runs on every tick of the price. It calculates the upper and lower Bollinger Bands for the specified period and standard deviation. -
The
iBands()function is used to calculate the Bollinger Bands. It takes various parameters such as the symbol (NULLmeans the current symbol), timeframe (0 means the current timeframe), period, deviation, price type (in this case,PRICE_CLOSEis used), band type (MODE_UPPERorMODE_LOWER), and shift (0 means the current bar). -
The current ask price is obtained using
Ask. -
The code then checks if the current price is above the upper Bollinger Band. If it is, it checks if there are no open orders (
OrdersTotal() == 0). If there are no open orders, it opens a sell order usingOrderSend(). TheOrderSend()function is used to send trading orders and takes various parameters such as the symbol, trade operation (OP_SELLfor sell), lot size, price (Ask), slippage, stop loss, take profit, comment, magic number, expiration, and color for the order line on the chart. -
Next, the code checks if the current price is below the lower Bollinger Band. If it is, and there are no open orders, it opens a buy order using
OrderSend()with the trade operation set toOP_BUYand the price set toBid.
That's the basic explanation of the code. It's a simple implementation that uses Bollinger Bands to generate buy and sell signals. However, it's important to note that this code doesn't include any risk management or additional trading logic, so it's recommended to further customize and test it according to your specific trading strategy and requirements.