Highs and Lows in Bollinger Bands
0
109
Highs and Lows in Bollinger Bands
By using multiple time frames and candlestick formations, you can discover how to pick highs and lows while trading the trend of the major time frame or chart.
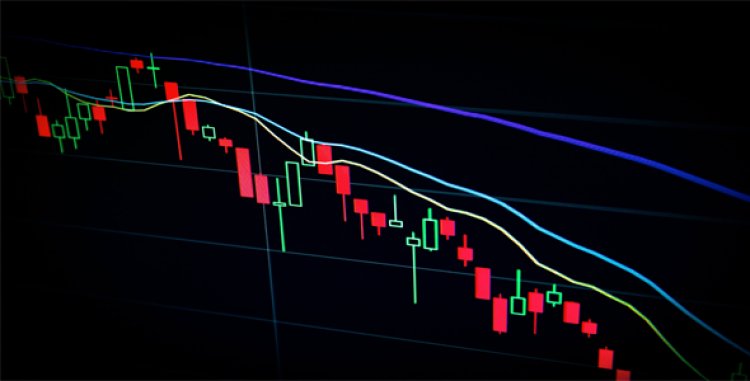
You start by looking at the daily chart to make sure of the direction in which you want to trade, using the middle line of the common Bollinger Bands indicators .
A pair trading above 20SMA is, in the short term, an upward trend. A pair trading below 20SMA is, in the short term, a downward trend.
Once the address is found, move to a smaller time frame, 4 hours and 1 hour; there a weakness is sought in the upward trend (the touch of the bands below), and a strength in the trend below (touch in the high of the bands).